![]()
![]()
03

Technical Information01.
Crystallization Containers and Methods
Technical Information02.
Protein Characterization as Quality Control
Since the start of the high-quality protein crystal growth experiment project, we have learnt that results of space experiments can be maximized by understanding the quality of the protein samples and improving it if necessary before launch.
Generally, a protein crystallization trial is started when a decent protein purity, i.e. a single band in SDS-PAGE, is obtained. While, JAXA carries out various measurements and assays to characterize the protein accurately.
Information on the devices used in the protein characterization is available here.
JAXA's laboratorySDS-PAGE with several conditions is run when we receive a sample because the electrophoretic pattern can be different depending on how to treat the sample.
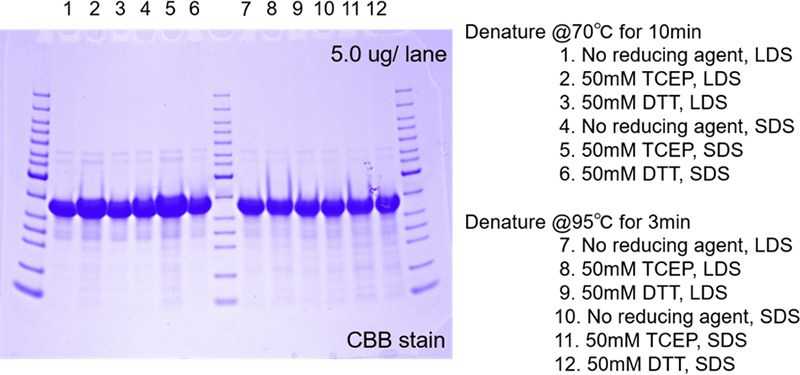
Fig. 1: SDS-PAGE of a protein secreted from a Pathogenic microorganisms. The sample was treated in various conditions as described in the figure.
SDS-PAGE is run using the sample treated in several denaturing temperatures, reducing agents and detergents. A hydrophobic protein may show an incorrect mobility because of aggregation caused by a high temperature treatment.
Sample homogeneity affects crystallization process more than purity under the microgravity. Success rate of inhomogeneous samples is significantly lower than those of homogeneous samples. Since overall charge, charge density and surface charge distribution of particles strongly affect homogeneity, high-resolution ion-exchange chromatography and native PAGE are applied. For a hetero oligomer, Blue Native (BN) PAGE can be applied to estimate the homogeneity of the quaternary structure of protein. If glycosylation is suspected, 2D-PAGE or mass spectroscopy can be used.
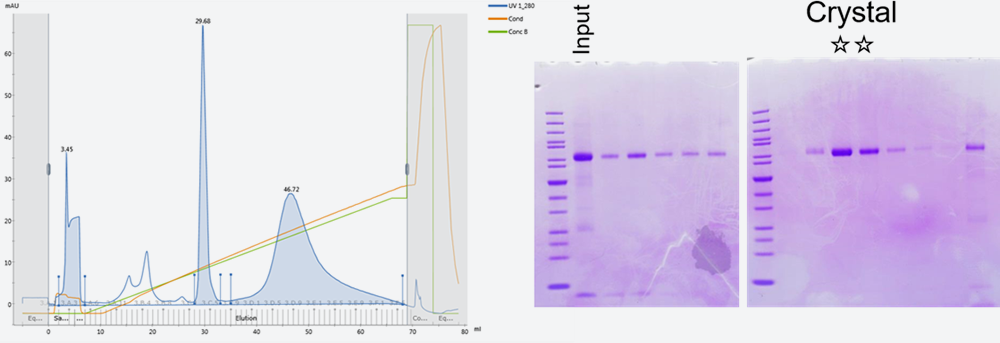
Fig. 2: Chromatogram of anion-exchange chromatography (left) and results of SDS-PAGE of a human protein (right)
SDS-PAGE after an affinity purification suggested the sample should be pure enough to crystallize. However, anion-exchange chromatography gave three peaks. Only the sample collected from the second peak was successfully crystallized.
Proteins with higher thermal stability is more likely to be crystallized and thermal stability of a protein can be improved by optimizing the pH, ionic strength and additives of the protein solution. Finding buffers, salt conditions and additives for stabilizing a protein is critical information for successful crystallization. The information also contribute to optimization of the buffers used in purification, leading to more effective purification.
Several methods are available for measuring thermal stability of a protein. We use the thermal shift assay (TSA), as the assay requires small amount of sample and can be processed in a high throughput manner. It should be, however, noted that some additives exhibit an apparent improvement of thermal stability in the TSA may cause aggregation of protein. Thus, a verification using a dynamic light scattering will be indispensable (see below).
Fig. 3 shows data on a protein which presented a variation of thermal stability by nearly 20?C between pH 6.0 and pH 8.5. For this protein, the higher order structure varies coordinately with the pH. Our research using TSA and the Multi-Detector SEC (see below) allowed us to identify the optimum pH-value which keep the higher order structure stable.
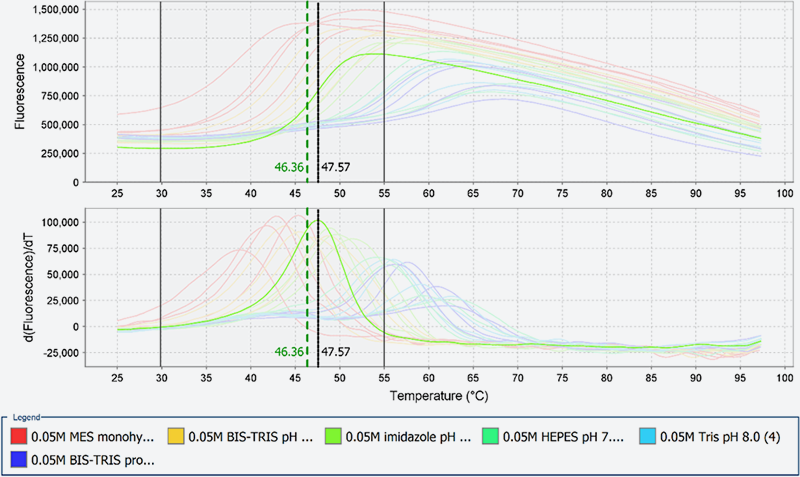
Fig. 3: Results of TSA of human drug target protein P
The TSA data shown here are obtained by StepOnePlus(Applied Biosystems)
Generally, monodispersed and homogenious protein particles in a solution are preferable for crystallization. To evaluate monodispersity of a protein solution, dynamic light scattering (DLS) technique is used. Our criteria for crystallization are as follws;
No aggregate are observed and the polydispersity (%Pd) ranges between 15% and 25%. DLS is also used for checking aggregation caused by an additive in a new buffer conditions suggested by TSA.
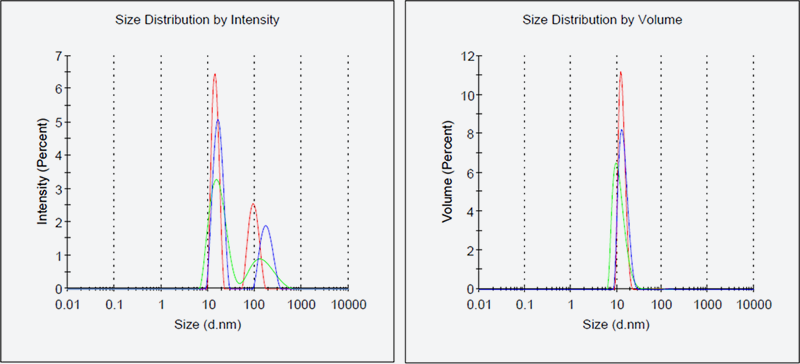
Fig. 4: Results of DLS of antibacterial drug target protein D
The left panel of Fig. 4 shows the intensity-based particle size distribution and the right panel shows the volume-based particle size distribution. Larger particles are more contribute to the scattering. Therefore intensity-based size distribution sometimes indicate aggregates that gives no peaks in the volume-based size distribution. Desirably, and ideally, no aggregation is observed in the intensity-based size distribution. Even if such an ideal condition is not available but if the volume-based size distribution indicate a low heterogeneity (%Pd<20) peak without aggregation, we make a start on the crystallization process.
The DLS data shown here are obtained by Malvern Zetasizer µV(Malvern Panalytical)
This section explains a technique for determination of absolute molecular weight by measuring the refractive index, UV/Vis absorbance and light scattering of a sample protein eluted from the gel filtration column. The formation of quaternary structure and aggregation.
This technique can be used whether the protein is present as monomer or oligomer in the solution or to check it for formation of heterocomplex.
Fig. 5 shows analyses of the abundance ratios of monomers, dimers and trimers.
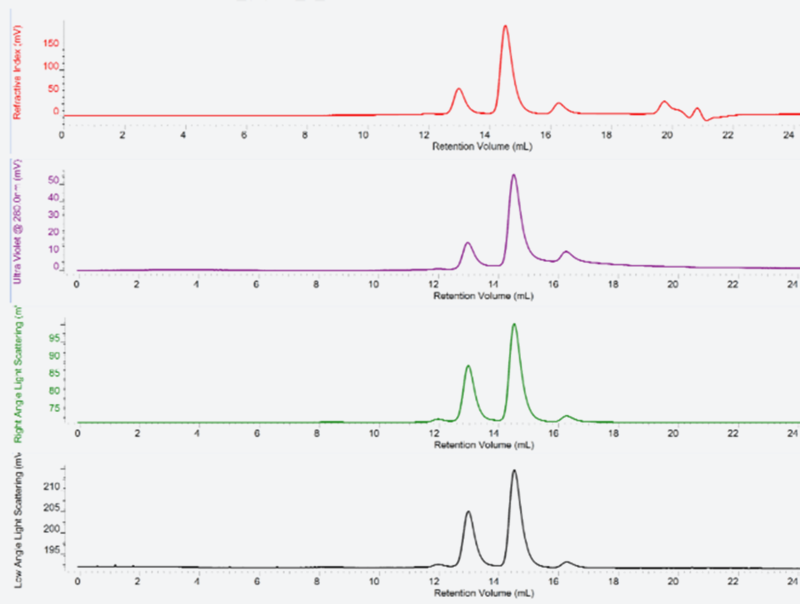
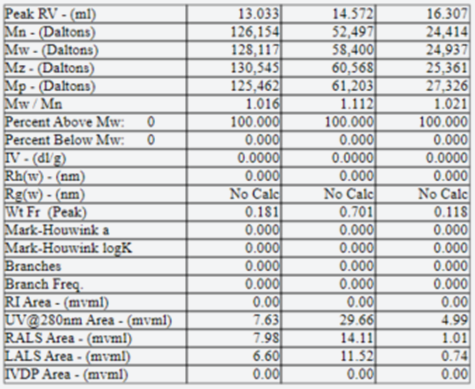
Fig. 5: Results of Multi-Detector SEC of a human drug target protein
This data was obtained by OmniSEC(Malvern Panalytical) system.